
Rankings by Goal
How can I use global rankings to support and leverage my advocacy messages?
Ranking countries can bring attention to gender equality more broadly, highlighting specific issues by comparing Index scores of countries around the world for each SDG. Rankings are easy to communicate and showcase a country’s position relative to others, and are thus often favored by media outlets.
Getting started
- Select a Region and Select up to 2 Countries, using the drop-down menus at the top of the screen (remove tick from boxes for default countries – Brazil and Chile in order to rank a single country or more than one of your choice).
- Select up to 2 Years to choose the reference year of interest – the defaults are 2015 and 2022 – but it’s possible choose a single year (e.g. what is the country ranking for the most recent year).
- Hover cursor over a circle under each SDG to see country, ranking and score. The lines connecting rankings are color coded by reference year.
- To output your viz image, see instructions below in Sharing and saving your Index viz.
An illustration
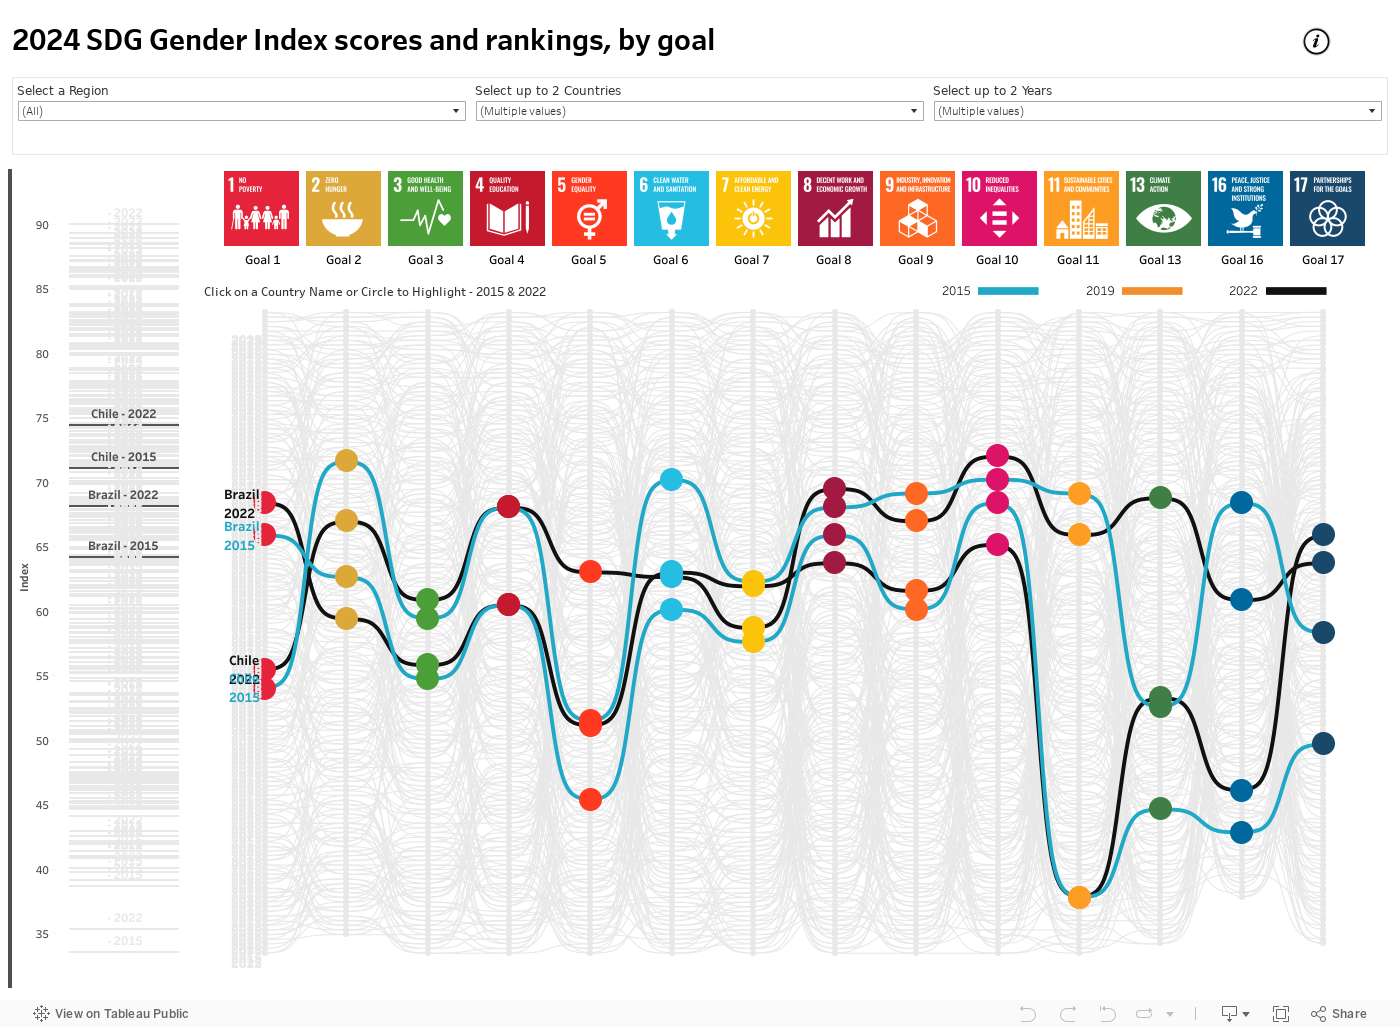
The opening view shows the 2015 and 2022 goal rankings for Brazil and Chile, start by opening up the drop-down for reference years (Select up to 2 Years) on the far right. Here untick the box for 2015, so that only the most recent year (2022) is showing. On the overall Index score in 2022, Chile was ranked 42nd in the world compared to 64th place for Brazil. But there are different patterns in relation to rankings across individual SDGs. For example, Brazil outranks Chile on SDG 1 on Poverty, SDG 7 on clean energy and SDG 17 on partnerships. But Chile is consistently ranked higher globally than Brazil on the remaining SDGs – for example on SDG 5 on gender equality Chile’s rank is 57th compared to 90th for Brazil. Chile’s highest rank globally is 32nd for Goal 10 on inequality and its lowest global rank is 78th on SDG 1 for poverty. Brazil’s highest global ranking is 42nd for SDG 1 on poverty and its lowest is for SDG 11 on cities – 127th in the world. To understand more about the factors underlying these differences – select these goals and explore the measures in the Indicators and Scores viz.
Sharing and saving your Index viz
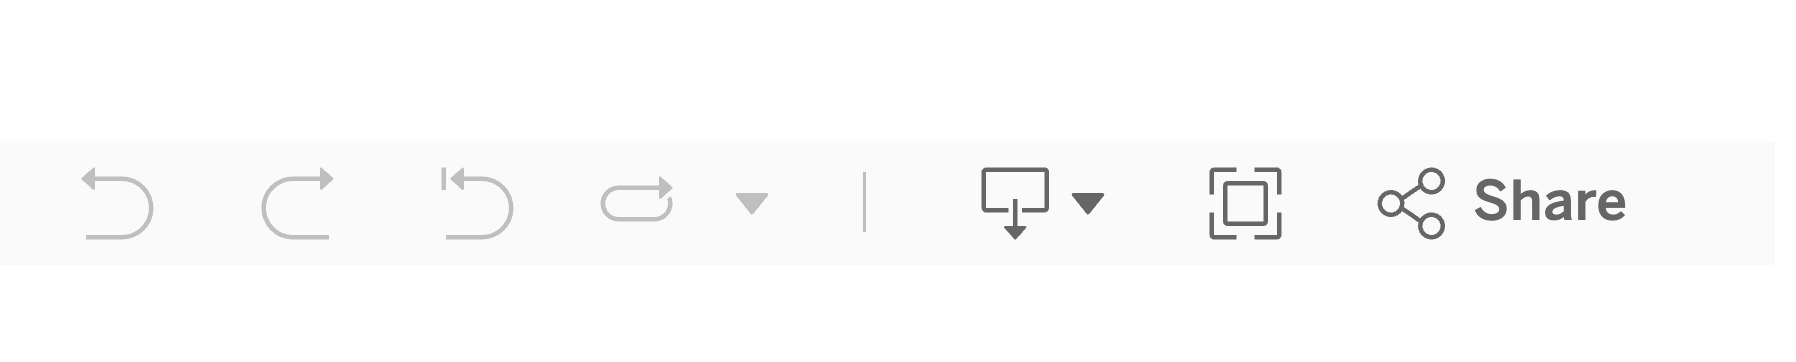
There are three buttons at the bottom right corner of each visualization that allow users to share the infographic by email or social media and to download the visualization in three different formats. Click on the relevant icon to share or save your country data in any of the four Index visualizations.
To share your viz image
Click on the Share icon

Select email, Twitter or Facebook link or copy link to share on other social media
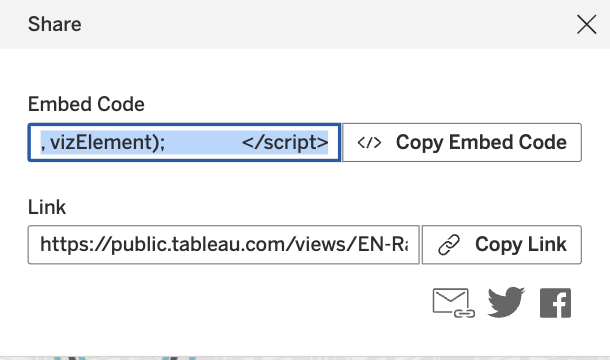
Follow instructions within social media platforms
To download your viz image
Click on the Download icon
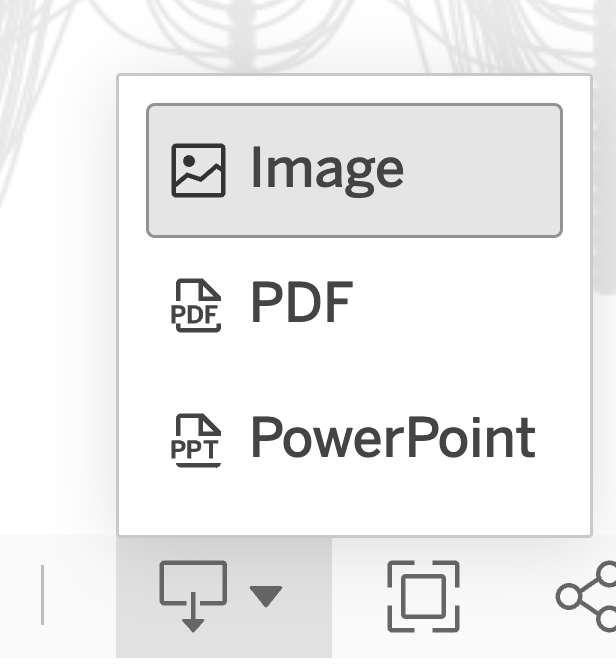
Select format for file