
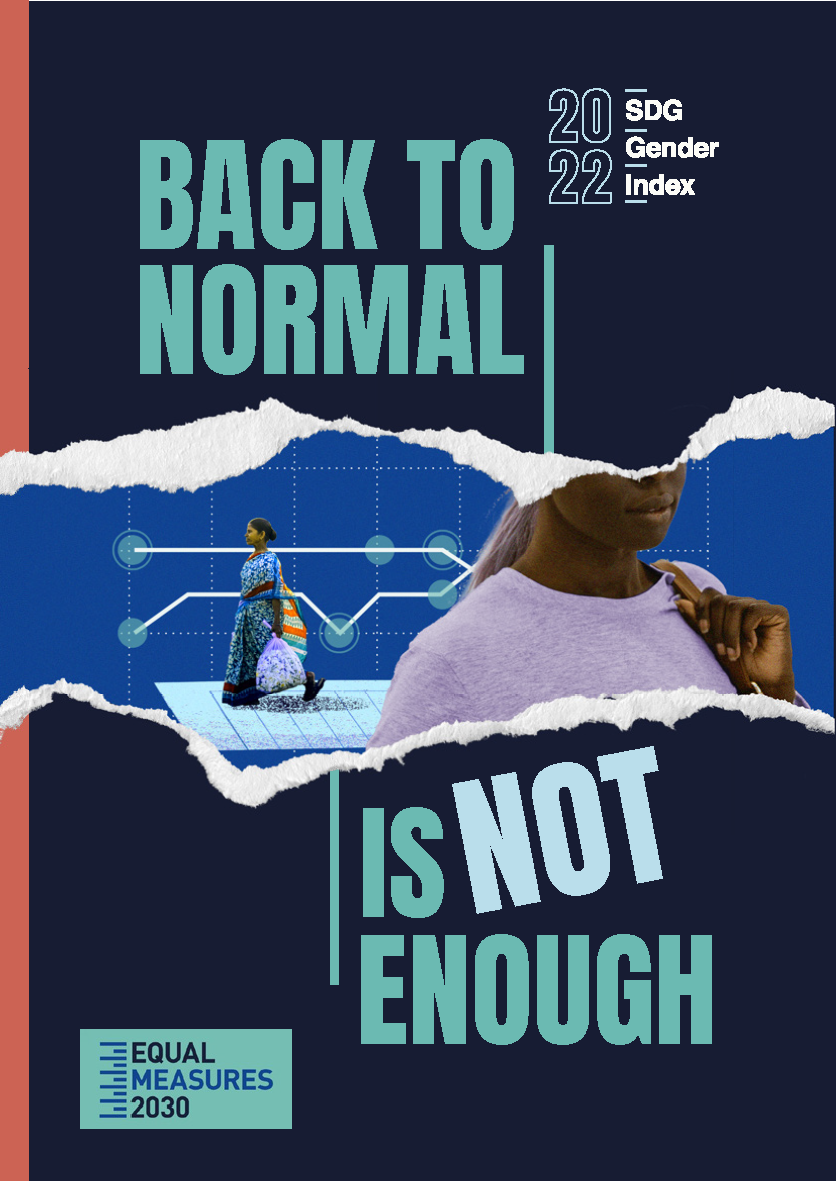
2022 SDG Gender Index
Back to Normal Is Not Enough
What is the EM2030 Gender Index?
The 2022 SDG Gender Index is the most comprehensive tool to measure progress towards gender equality by 2030. Developed by EM2030 – the leading global partnership on accountability for gender equality and the SDGs – it provides a snapshot of where the world stands on the vision of gender equality embedded in the 2030 Agenda, a vision long fought for by gender advocates worldwide.
By showcasing where progress is happening – and where it isn’t – the Index aims to drive action on gender equality such that momentum towards equality becomes resilient, sustainable, and, ultimately, unstoppable.
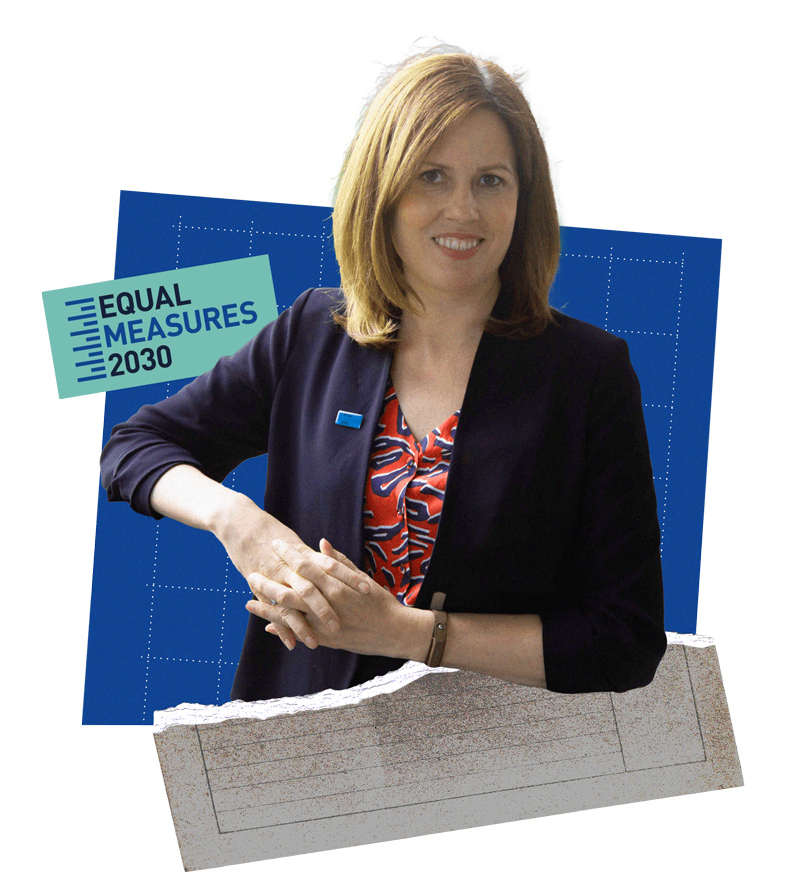
Our Index shows the world is off track on the SDGs. The seeds for the fall-out from the COVID-19 pandemic were sown long before the virus started spreading. Millions of women were already dealing with a squeeze on household budgets, poor health care and evaporating social safety nets. But rapid change on gender equality is possible and the Index provides a ‘blueprint’ for governments to help make that change happen.
Alison Holder, Director of Equal Measures 2030
Key Findings
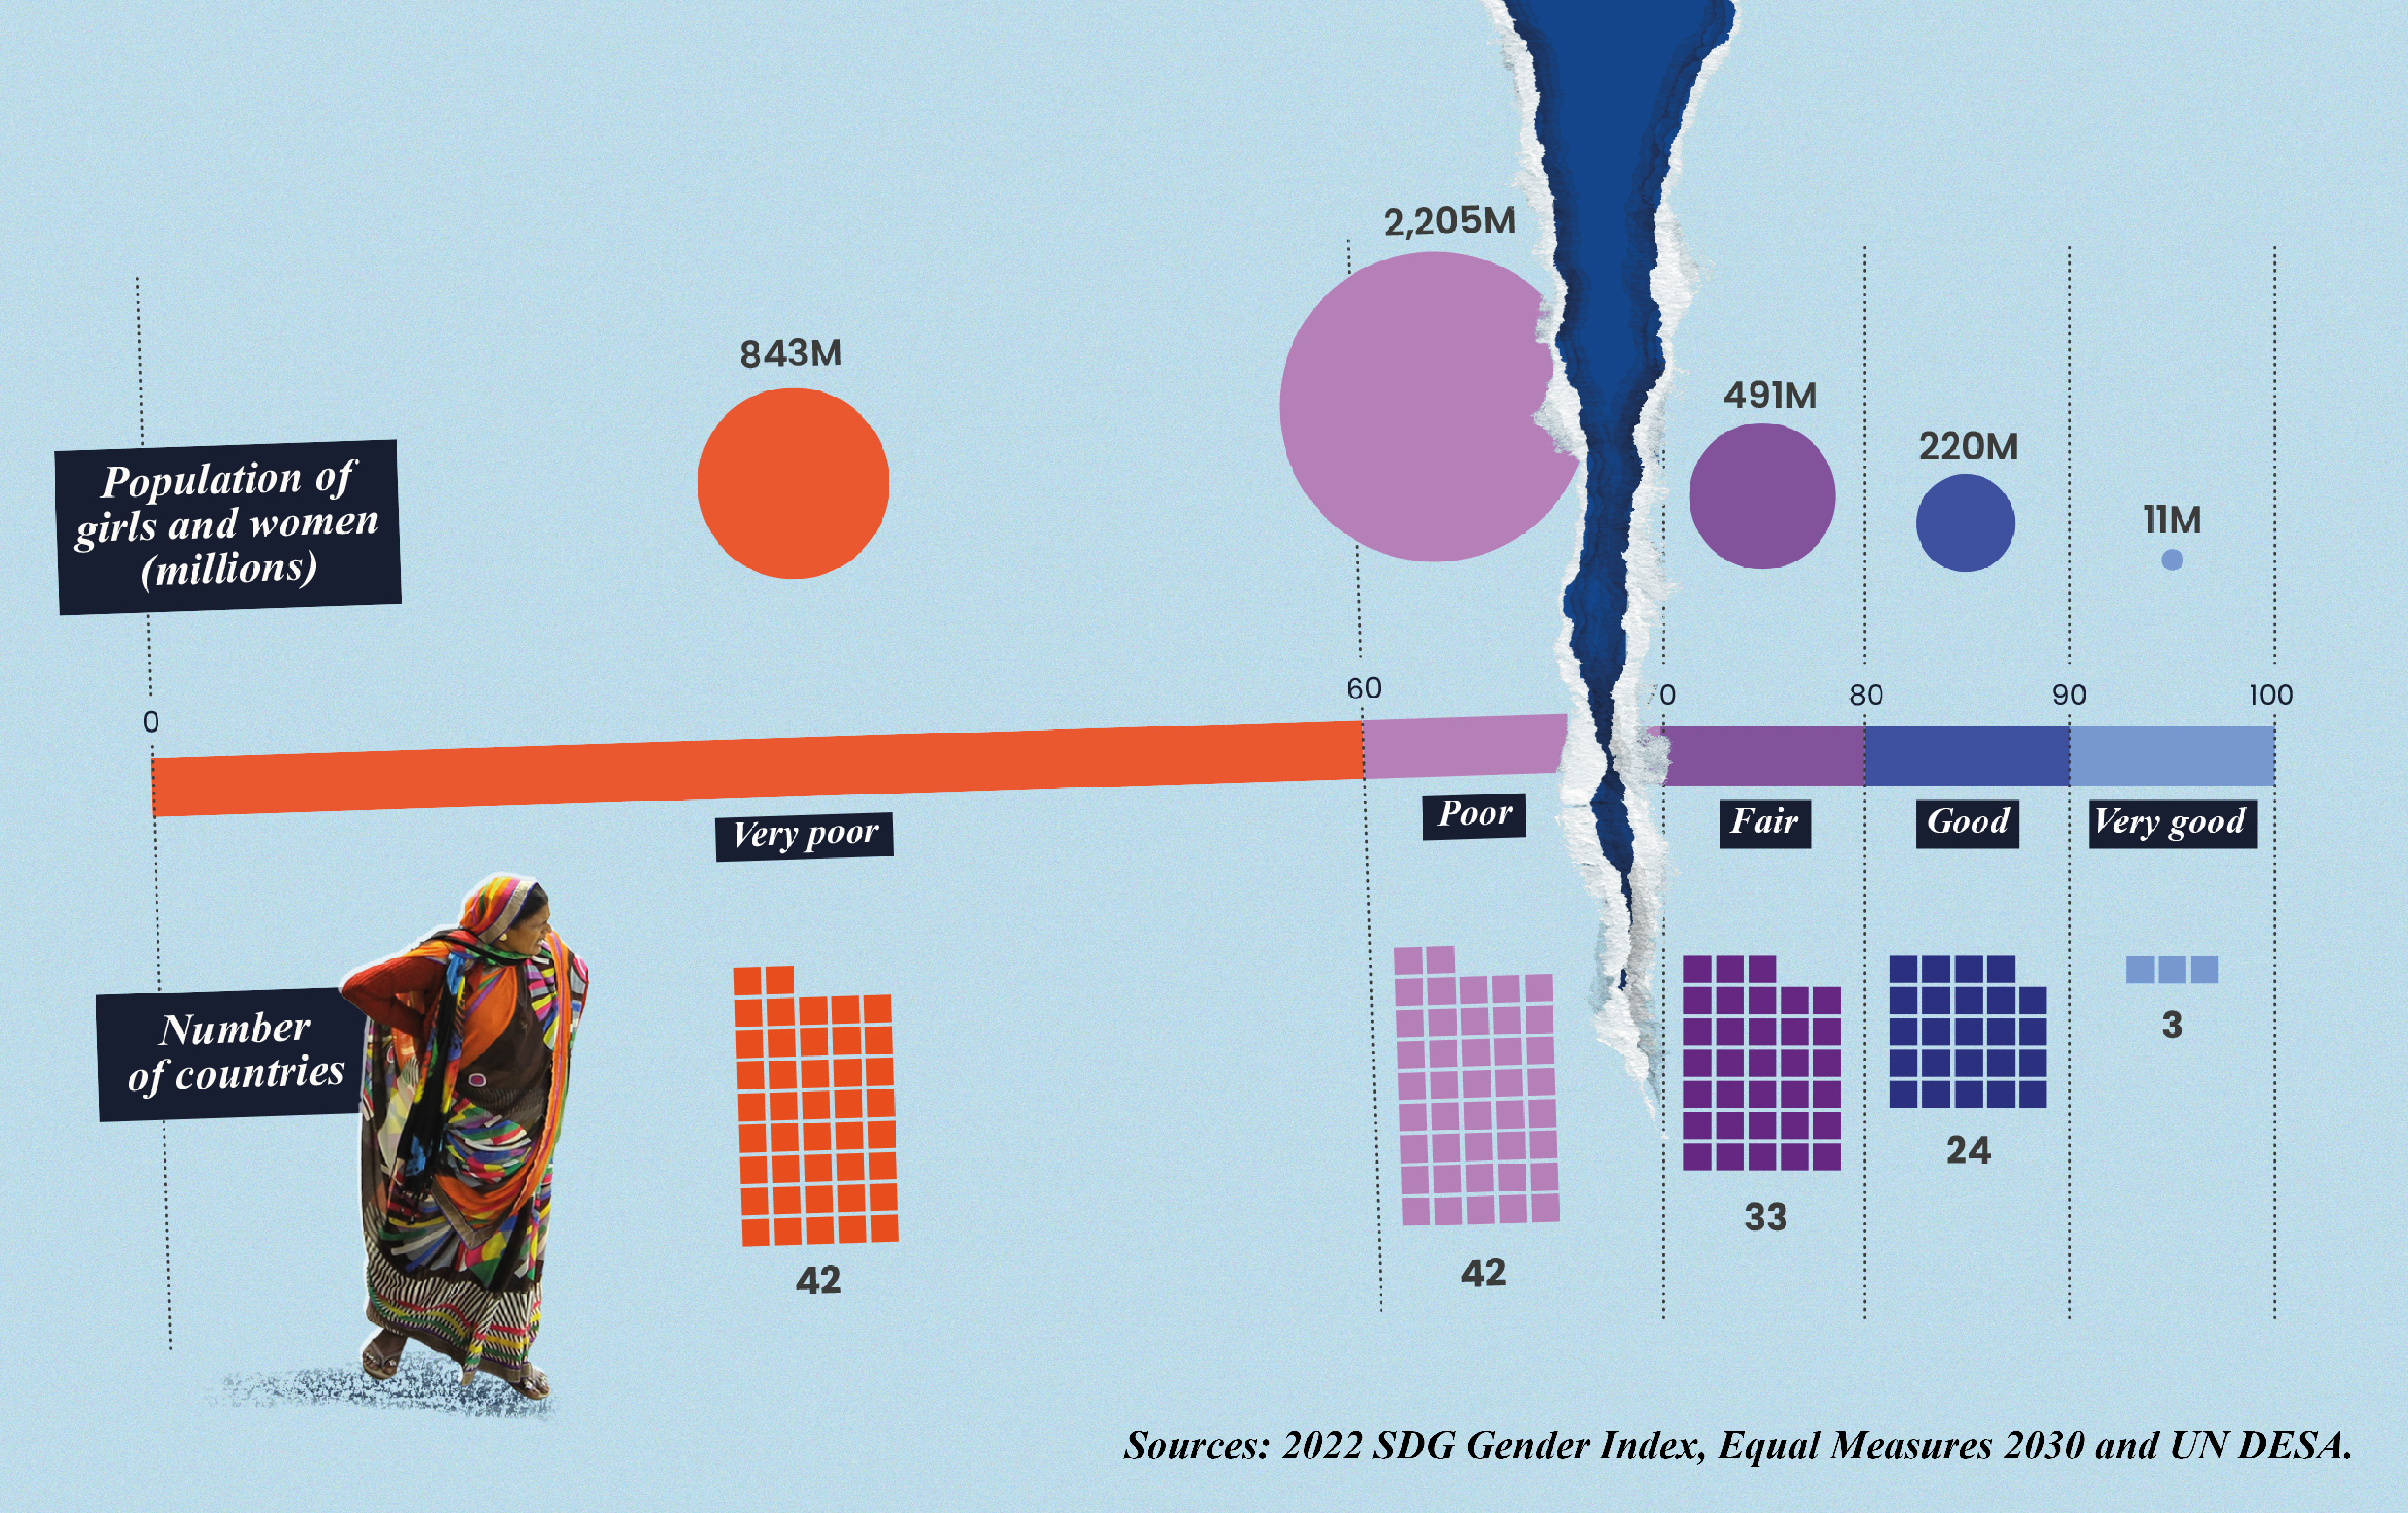
The 2022 SDG Gender Index finds little progress on gender equality at the global level between 2015 and 2020. If current trends continue, the global score will reach only 71 out of 100 by 2030, the deadline for the achievement of the SDGs. And even this projection could be seen as optimistic, given the impact the COVID-19 pandemic has already had on the well-being of girls and women worldwide.
Trends and projections for SDG Gender Index scores from 2015 to 2030
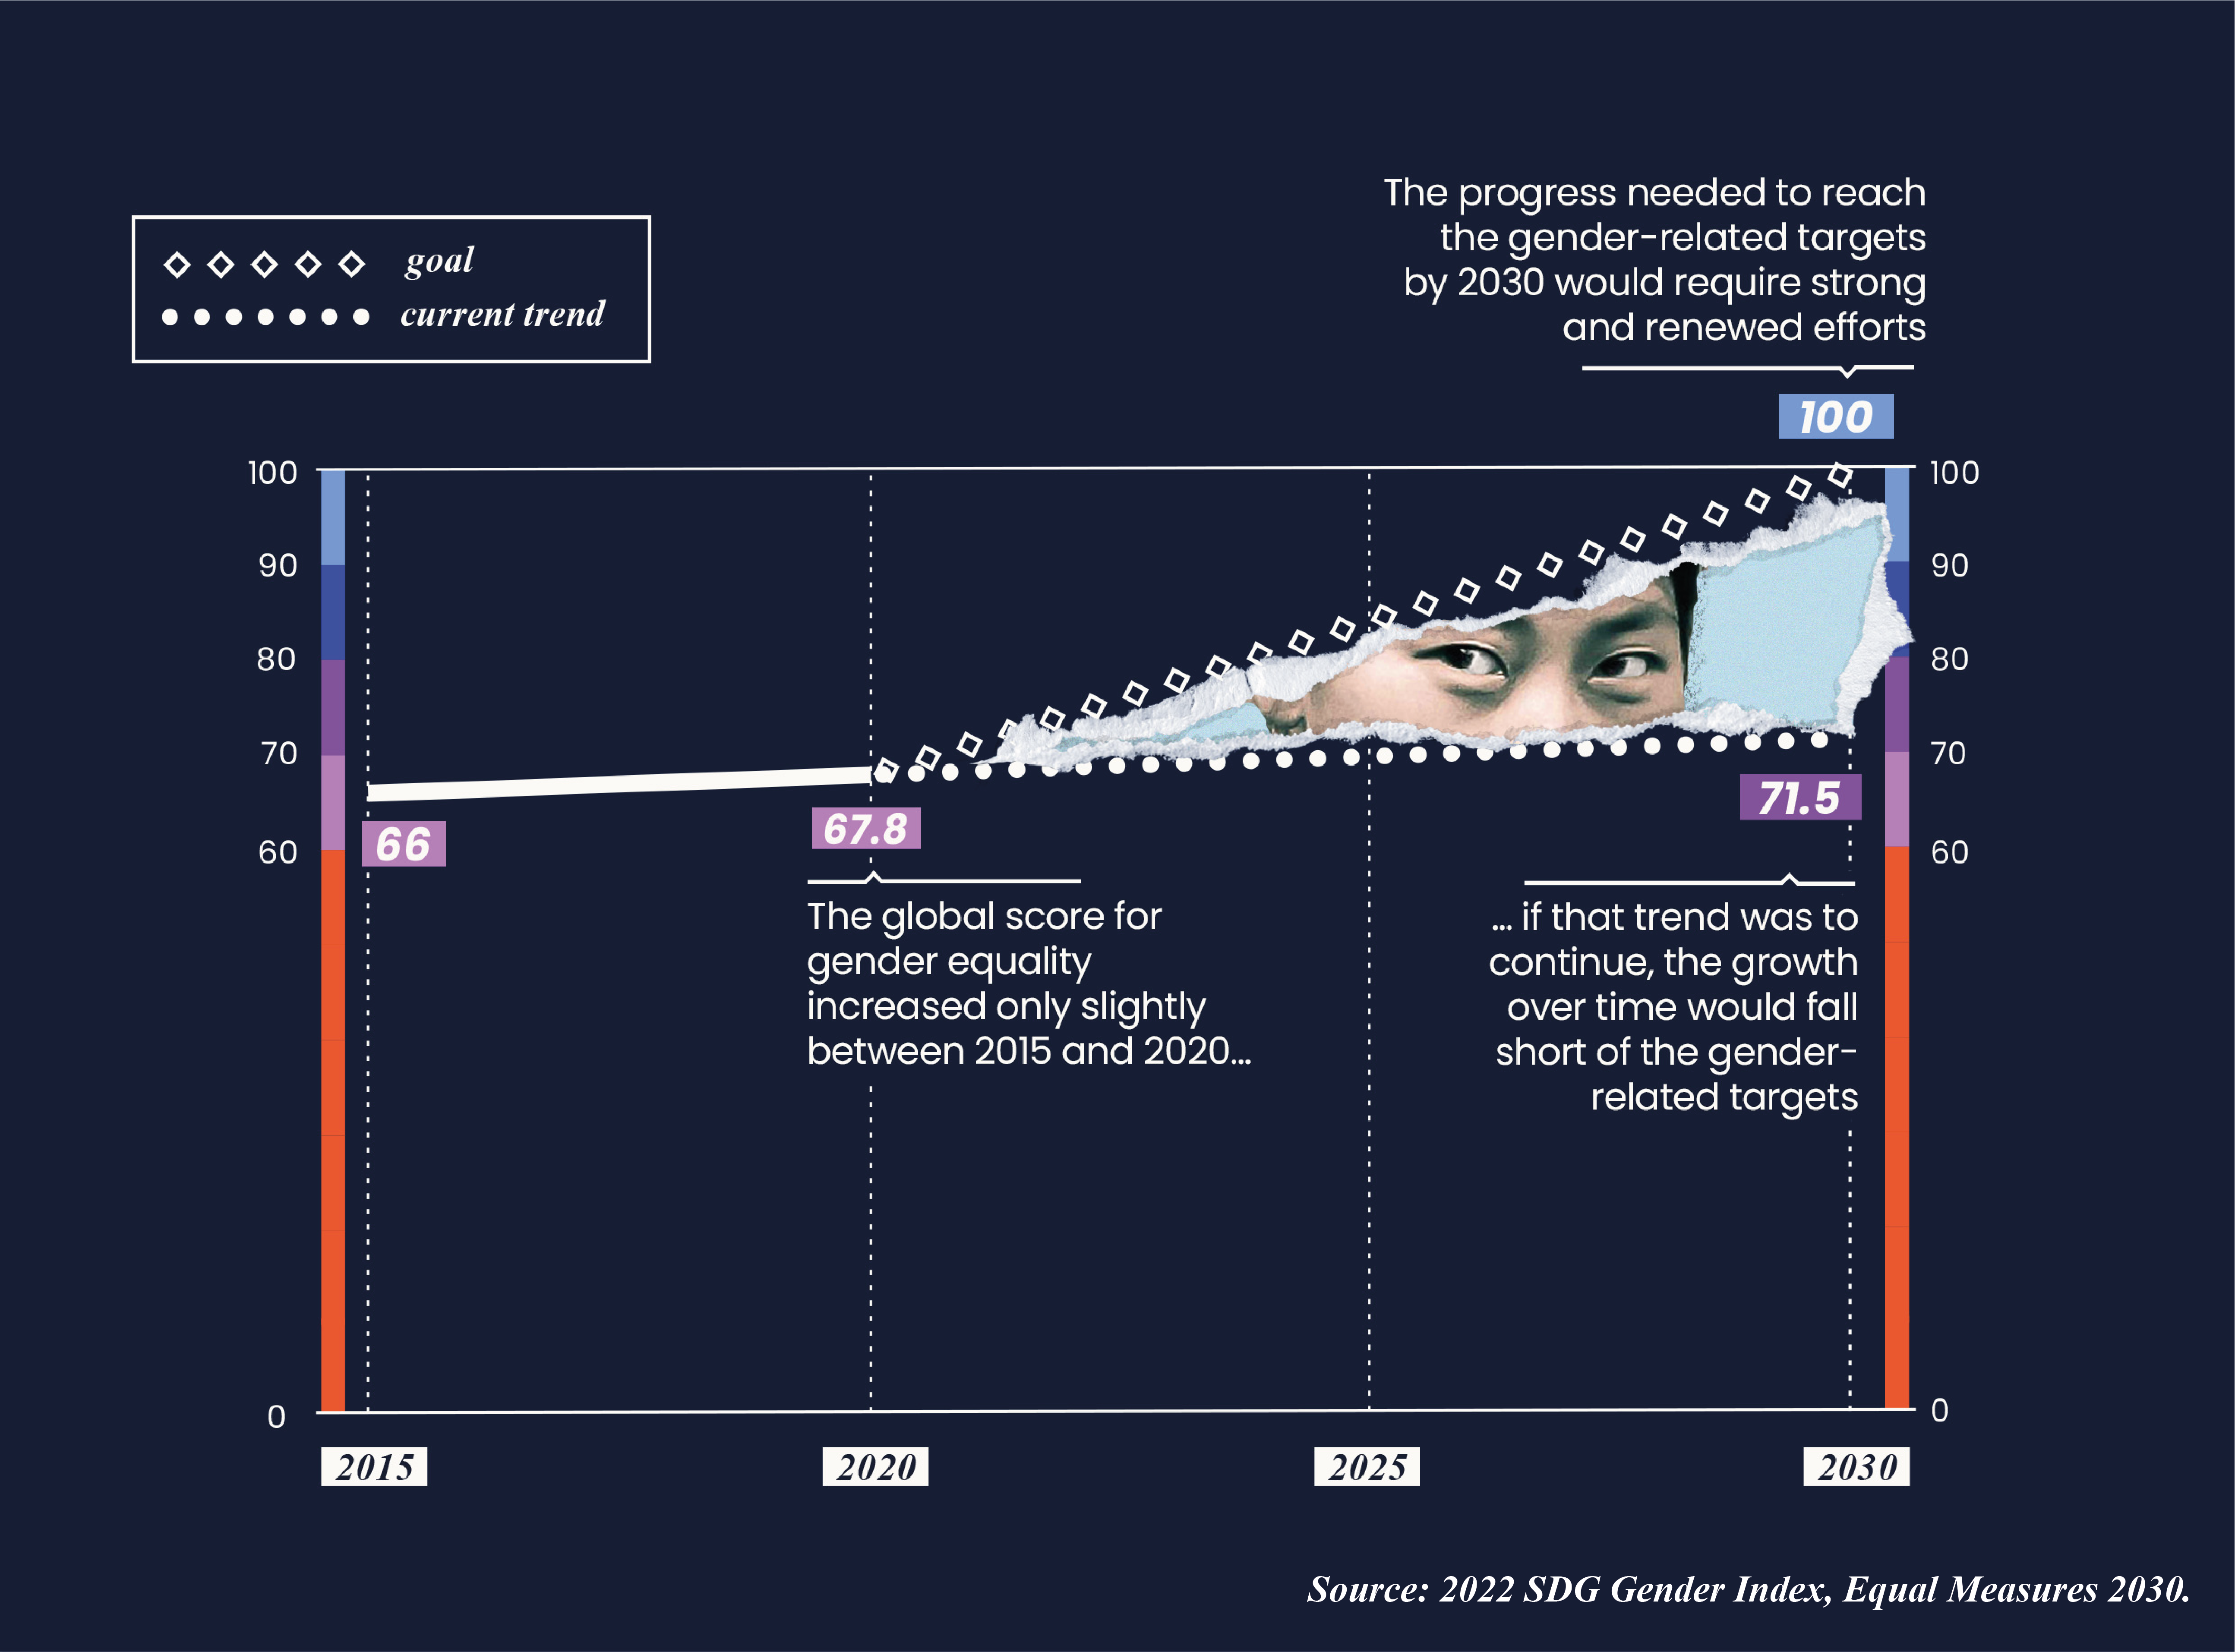
More than three billion girls and women still lived in countries with ‘poor’ or ‘very poor’ scores for gender equality.
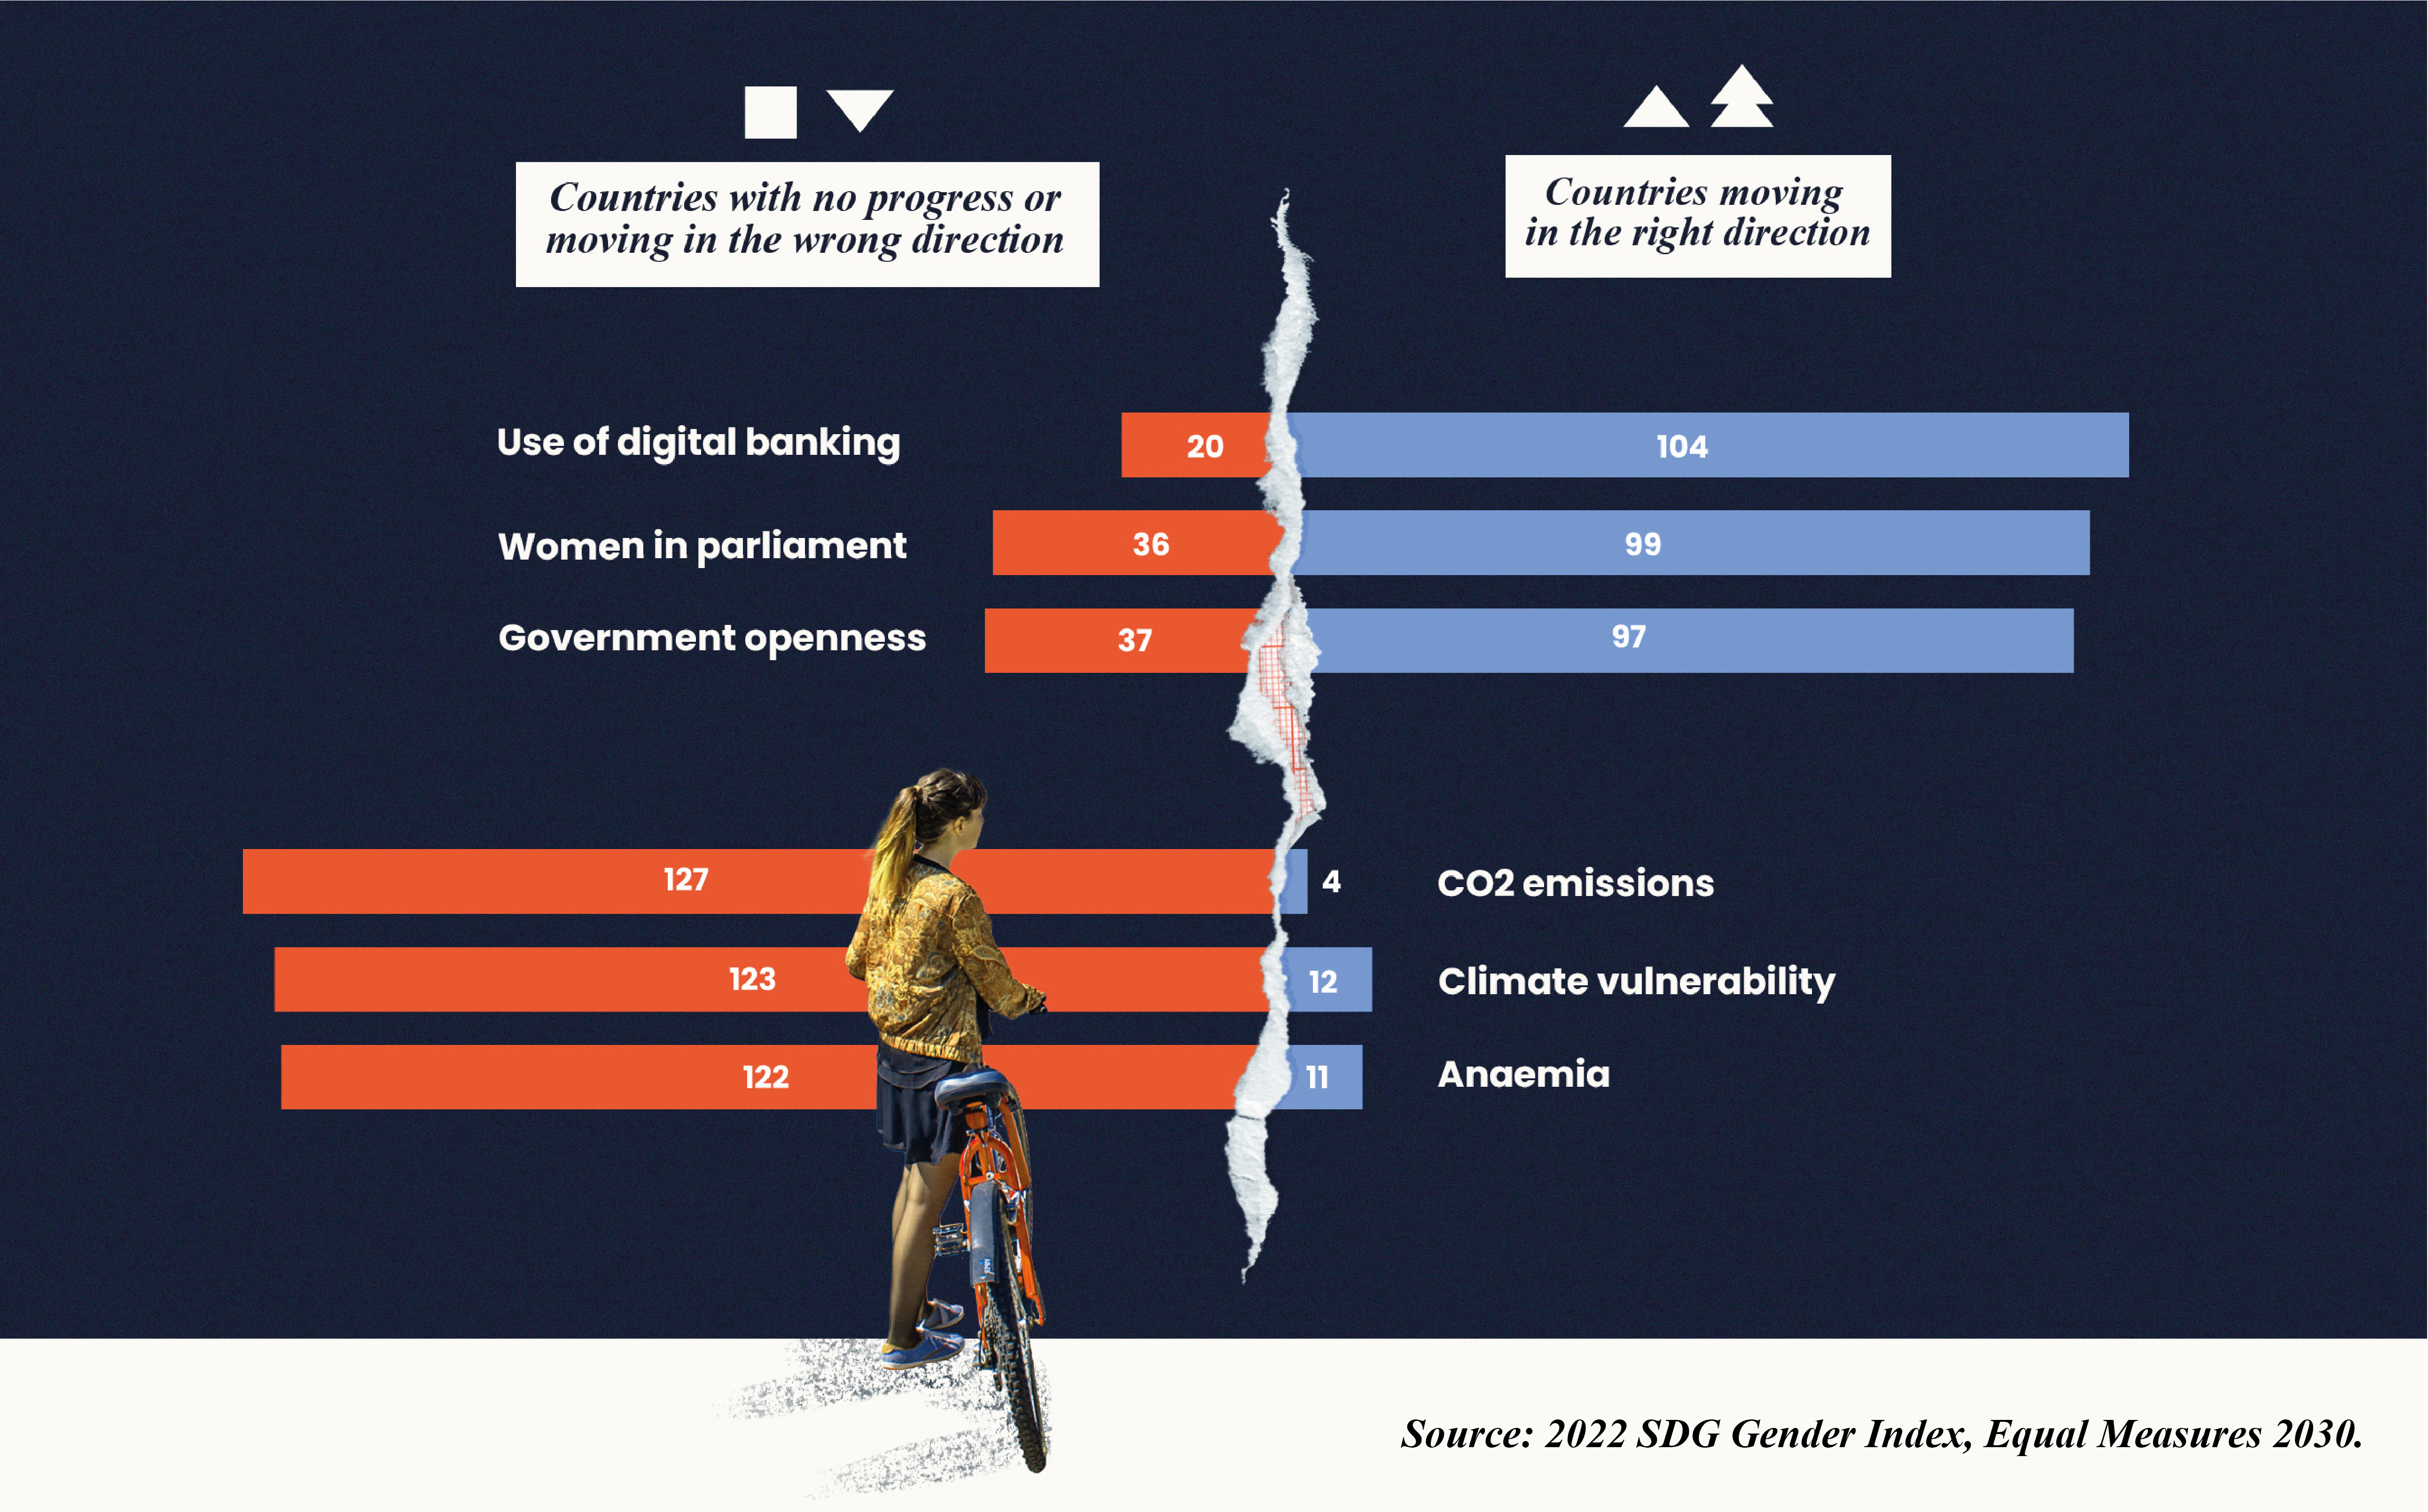
On some issues in the index, the majority of countries are moving in the right direction : but on other issues the majority is moving in the wrong direction.
Informing a Blueprint for Change
The 2022 SDG Gender Index sets out a blueprint for change, based on six cross-cutting themes that often characterize the countries and regions making some progress on gender equality.
- Reform and apply inequality laws: Countries that reform and fully implement gender equality laws have better health, nutrition and educational outcomes for women and their families, more resilient employment for women, and more women in their parliaments.
- Invest in public services and social (including care) infrastructure: The social transformation needed for gender equality must be funded, which requires gender-responsive budgets, progressive taxation and strong investment in public services and public (including care) infrastructure.
- Promote the leadership, participation and voice of girls and women: The key is to combat gender norms and promote role models, with the greater visibility of women in public life creating a virtuous circle of participation
- Close the gender data gaps: This means investing in improving data infrastructure and formalizing the idea of a gender data ecosystem, but also mobilizing and building bridges between different stakeholders and data communities, and making good use of ‘big data’.
- Invest in, create space for, and listen to feminist organizations and movements: Little progress on women’s rights would have been made without pressure and advocacy from these organizations and movements. They need proper resourcing and safe, secure spaces in which to operate and advocate.
- Work with and empower girls and young women: Their voices should be heard in the decisions that affect them. Programmes, policies and laws designed with and for them, and funding for their groups, are critical for accelerated progress towards gender equality.
2022 SDG
Gender Index