
Indicators and Scores
How can I use indicators and scores to support and leverage my advocacy messages?
Explore the drivers of change for country’s different SDG goal scores and identify why a score has changed by viewing individual indicator trends have improved or gotten worse since 2015. One can also see how these changes compare to other countries around the world. The 56 gender-related indicators capture legal frameworks, women’s views on a range of issues, policy outcomes including SDG, CEDAW and national targets and commitments.
Getting started
- Select an SDG Goal using the dropdown menu – to see a list of all possible indicator choices, click on View Full List of Indicators.
- Select an indicator from the list that appears below the Select SDG Goal to View Indicators menu.
- A description of the selected indicator will appear below the Reference Year box.
- The default reference year is 2022, but one can also select other years, either 2015 or 2019.
- Hover the cursor over the map and select a country of interest.
- View the chart on the right-hand side of the viz which shows Index scores for the indicator for all countries sorted by score level.
- The table provides the indicator value in its original metric, its standardized index score for the indicator and the actual reference years.
- Hover cursor over circles in the chart to see other country values. The line represents the average score for the corresponding region.
- To output your viz image, see instructions below in Sharing and saving your Index viz
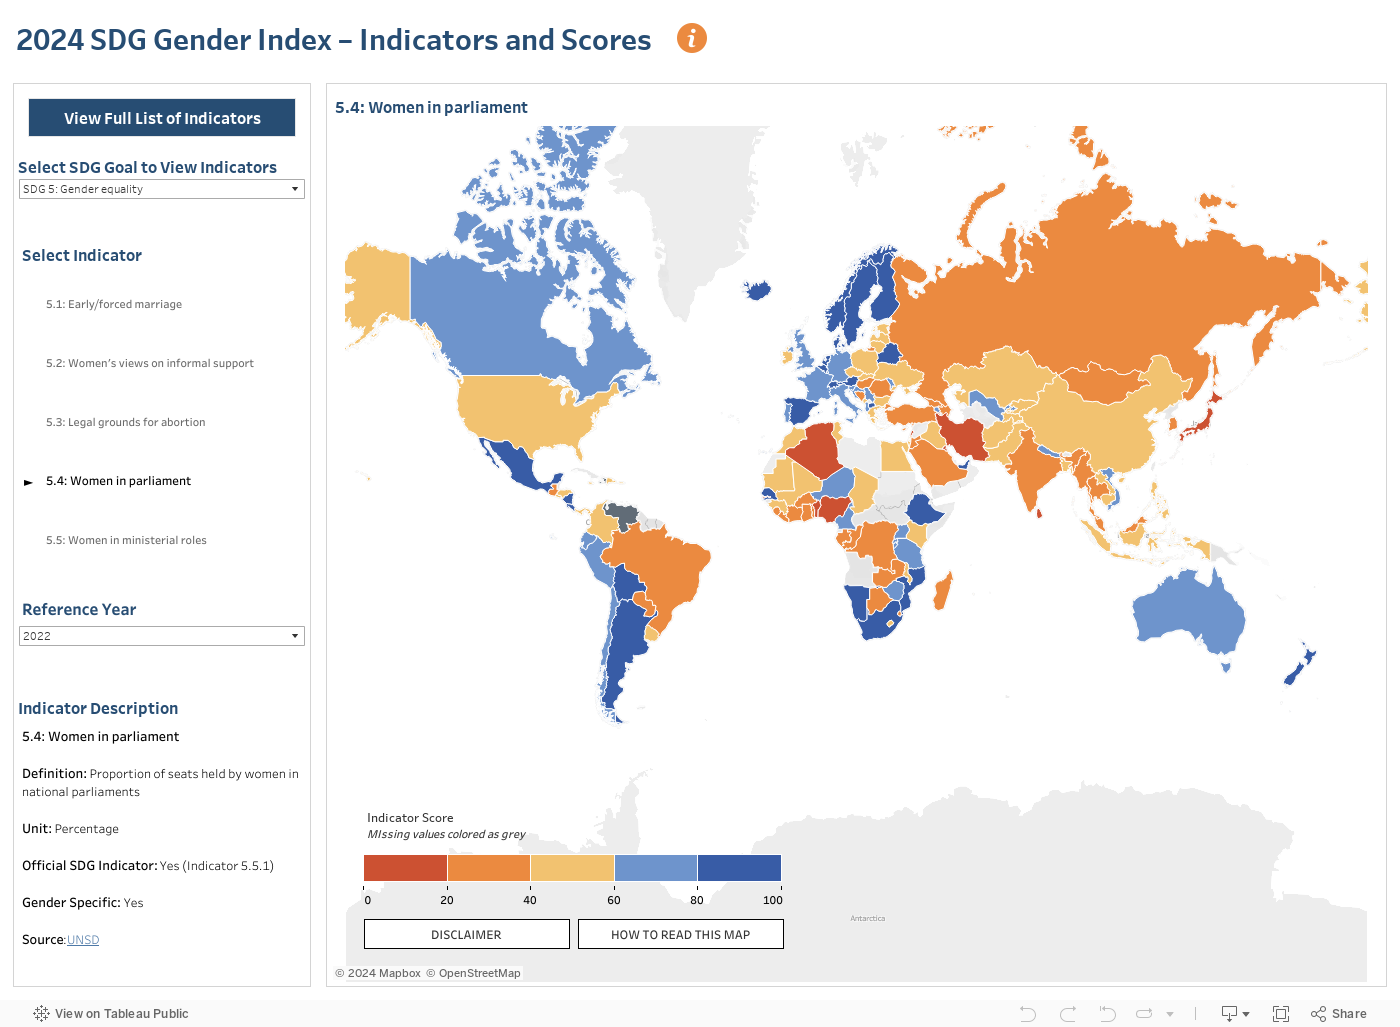
An illustration
The default view shows the indicator 5.4 Women in parliament for the latest years available (2022). A description of the indicator appears below the Reference Year box. Select Mexico by clicking on the map. In looking at the table and chart that appear on the right-hand side of the viz we can see that Mexico improved from 42.4% in 2015 to 48.2% in 2019 and reaching perfect gender parity of 50.0% in 2022. Mexico’s corresponding Index score for this indicator was 100 in 2022. From the 2022 Indicator Score by Region viz below the table the larger blue circle represents Mexico’s score. It is one of only a handful of countries around the world that achieved the target in 2022 and was well above the regional average for Latin America and the Caribbean was 62.7 points in 2022 (second highest regional score after Europe and North America at 64.2 points).
Sharing and saving your Index viz
There are three buttons at the bottom right corner of each visualization that allow users to share the infographic by email or social media and to download the visualization in three different formats. Click on the relevant icon to share or save your country data in any of the four Index visualizations.

To share your viz image
Click on the Share icon

Select email, Twitter or Facebook link or copy link to share on other social media
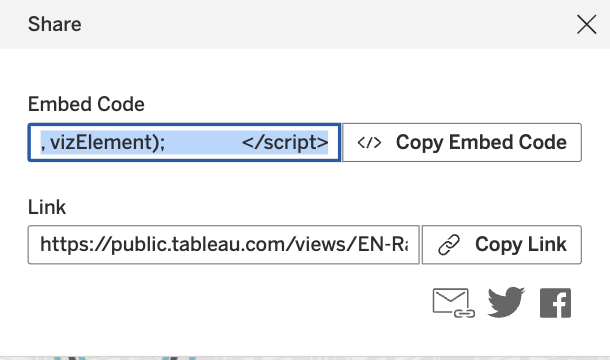
Follow instructions within social media platforms
To download your viz image
Click on the Download icon
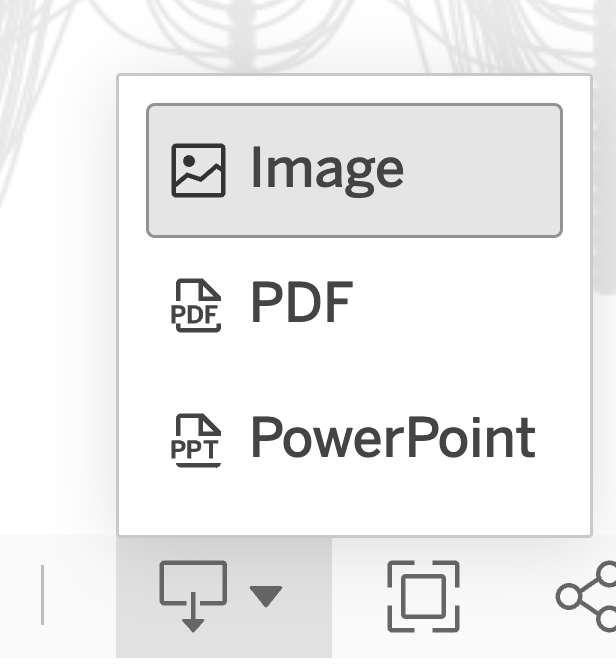
Select format for file