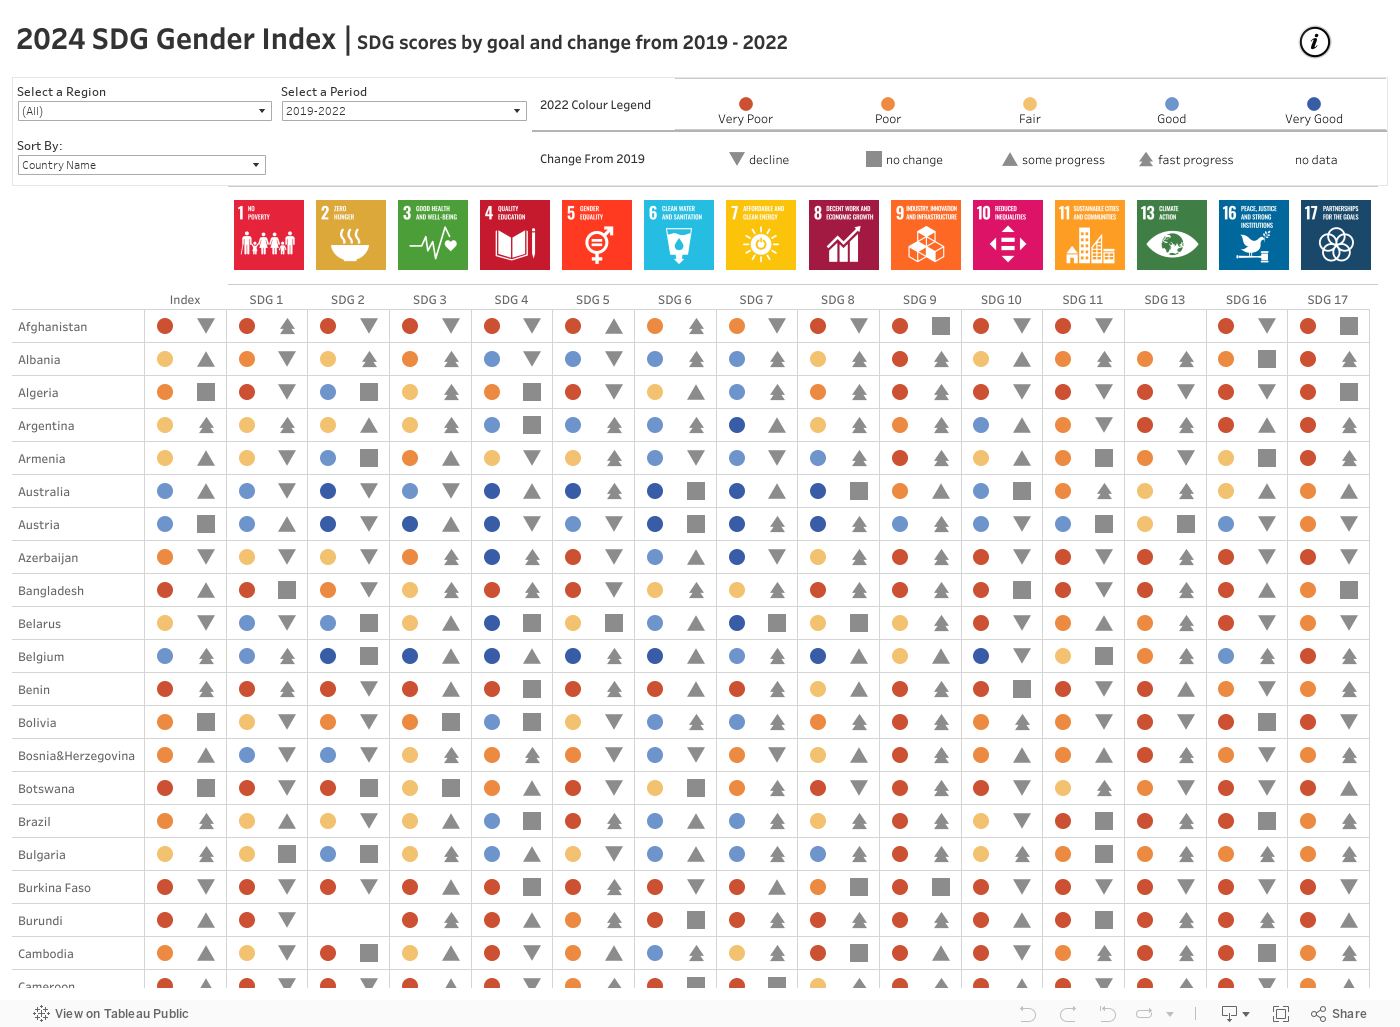
Score by Goal
How can I use a heat map to support and leverage my advocacy messages?
The heat map provides a quick visual on how a country is performing on gender equality across each of the SDG goals. Users can quickly spot an area which is a strength or a weakness for countries, and assess whether the situation has improved or deteriorated in recent years in comparison.
Getting started
- Select a region from the dropdown menu.
- Sort by Index score, the score for any single SDG, or by country name in alphabetical order in the dropdown menu.
- Select a Period of time – there are four periods to choose from 2015-2019, 2019-2022, 2015-2022 and 2022-2030.
- Hover cursor over an icon to see the country score or change in points for any time period.
- See the legend for the definition of each icon – either score level or score change – for the selected period.
- To output your viz image, see instructions below in Sharing and saving your Index viz.
An illustration
The opening view shows scores sorted by country name in alphabetical order for the period 2019-2022. Open the Sort By: dropdown menu and select Index. One can see the top-scoring countries on the Index, starting with Switzerland in the top spot. Even so, no country, even those ranking in the top 10, have good scores on gender equality for every goal. For example, Netherlands and Luxemburg had ‘poor’ scores on SDG 13 on climate action – and Netherlands’ score has worsened from 2019. By changing the period to 2015-2019, we can see that other countries in the top 10 were struggling with SDG 13. Being able to see the level of a score as well as the direction and magnitude of change relative to a specific reference year can provide compelling insights on a country’s overall progress on gender equality.
Sharing and saving your Index viz
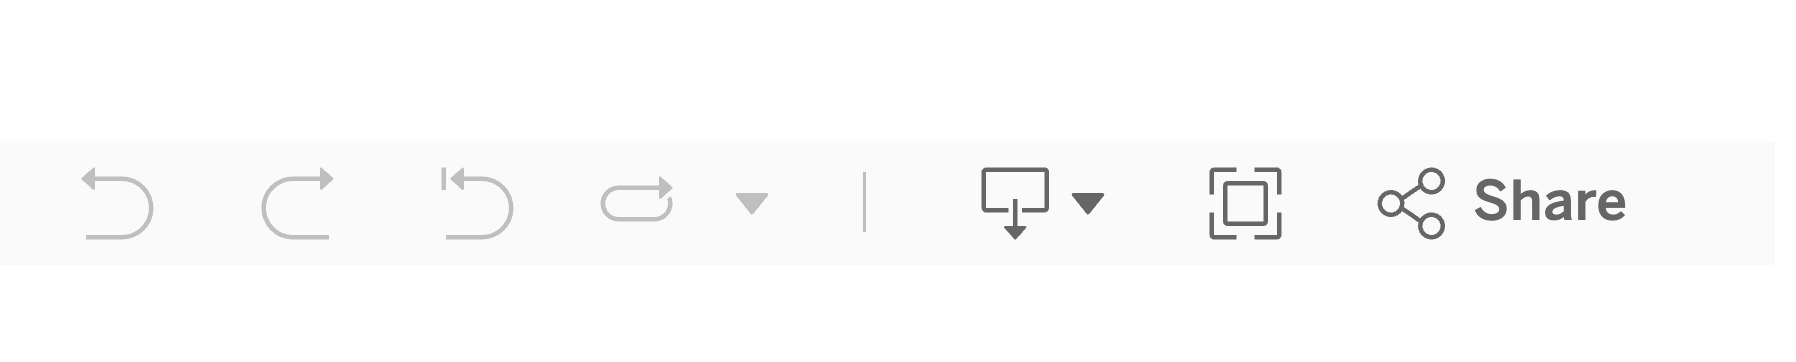
There are three buttons at the bottom right corner of each visualization that allow users to share the infographic by email or social media and to download the visualization in three different formats. Click on the relevant icon to share or save your country data in any of the four Index visualizations.
To share your viz image
Click on the Share icon
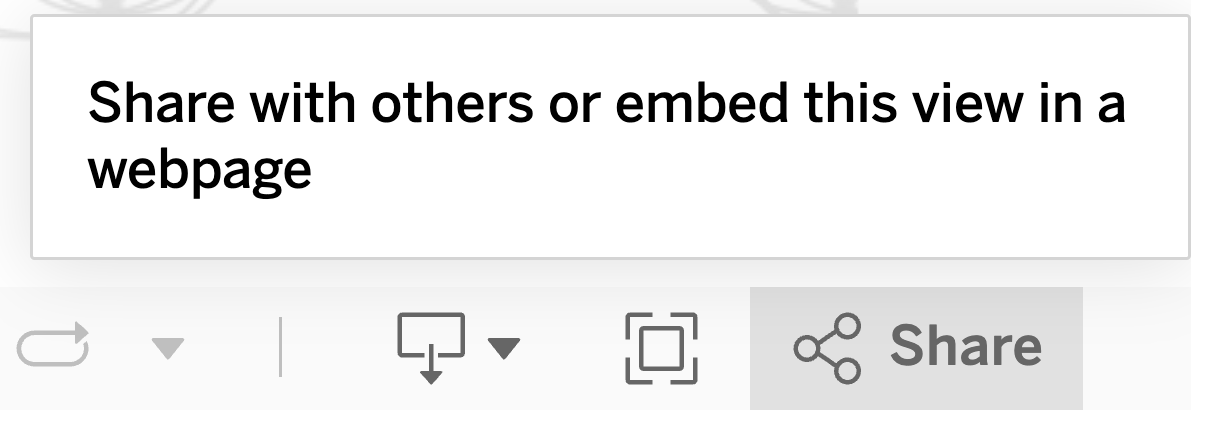
Select email, Twitter or Facebook link or copy link to share on other social media
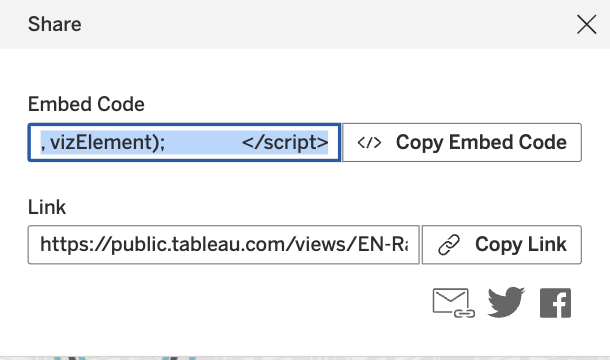
Follow instructions within social media platforms
To download your viz image
Click on the Download icon
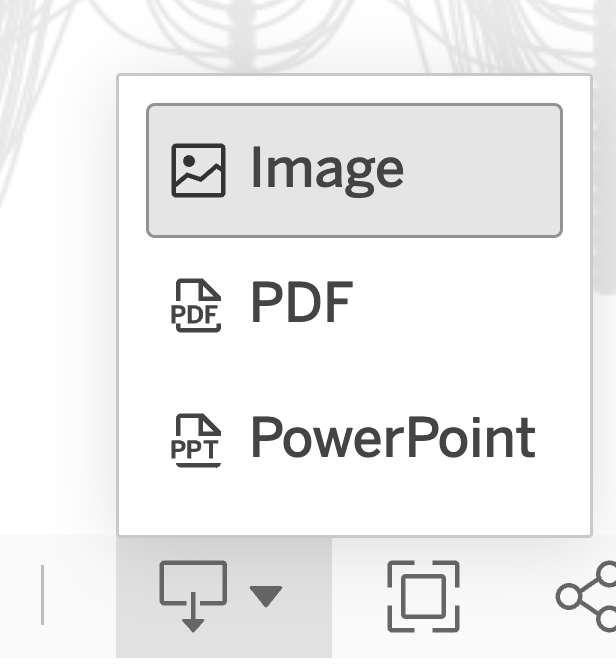
Select format for file