Country Scores
How can I use country profiles to support and leverage my advocacy messages?
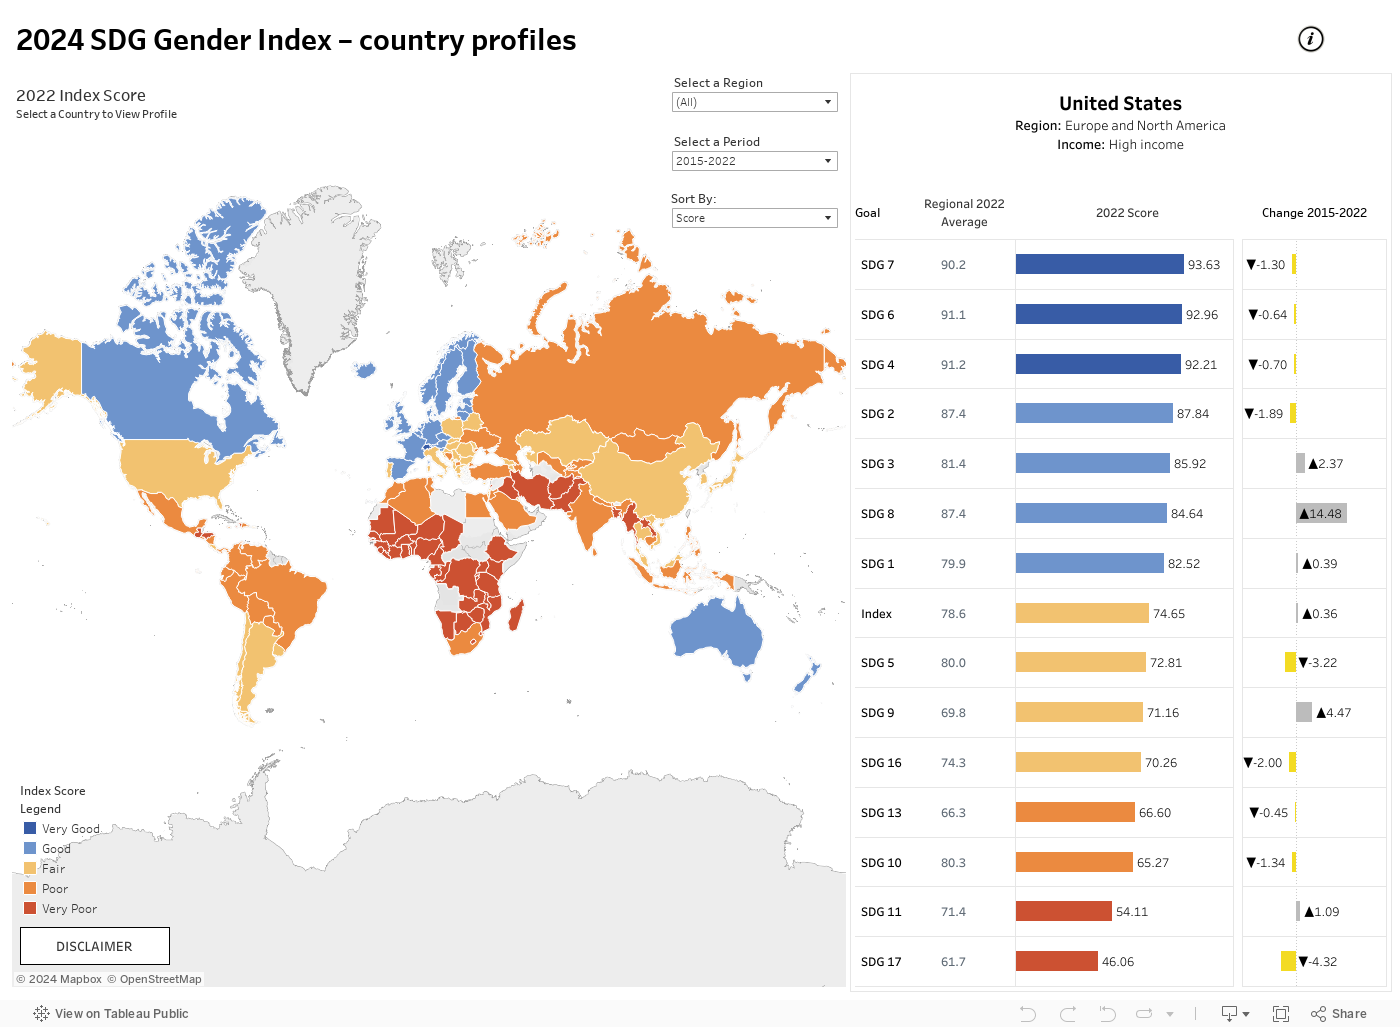
The country profile provides a comprehensive overview for gender equality that uses three different benchmarks. These benchmarks can be used to build a narrative on the areas of strengths and weaknesses for a country: 1) how close or far a country is to the absolute target score of 100 points; 2) how a country’s score compares to the other countries in its geographic region; and 3) how a country score has changed for each SDG for different time periods.
Getting started
- Hover the cursor over the map to find your country of interest.
- Select by clicking on a country on the map (the United States appears as a default but will be replaced by your selection) or Select a Region to choose a country highlighted by region.
- Select a period from drop-down menu. The default is 2015-2022, but 2015-2019, 2019-2022 and 2022-2030 are also available.
- View the bar chart on the right of the screen.
- Sort By: Select Goal to see a country’s score level and change over the period ordered by SDG from Goal 1 to 17 or select Score to see a country’s score level and change over the period ordered by highest to lowest SDG score.
- To output your viz image, see instructions below in Sharing and saving your Index viz
An illustration
The default view shows the country profile for the United States from 2015-2022 and sorted by Score. We can see that the United State’s strengths or highest scores (all “Very good”) on gender equality by Goal are: SDG 7 on clean energy, SDG 6 on water, and SDG 4 on education. Its weaknesses, or lowest scores, are for SDG 17 on partnerships and SDG 11 on cities. The United States under-performed compared to the average for Europe and North America on 6 of the 14 goals, especially for SDG 11 on cities, SDG 17 on partnerships and SDG 10 on inequality. Since 2015, the United States improved its score the most for SDG 8 on work and saw its score drop the most for SDG 17 on partnerships and SDG 5 on gender equality.
Sharing and saving your Index viz
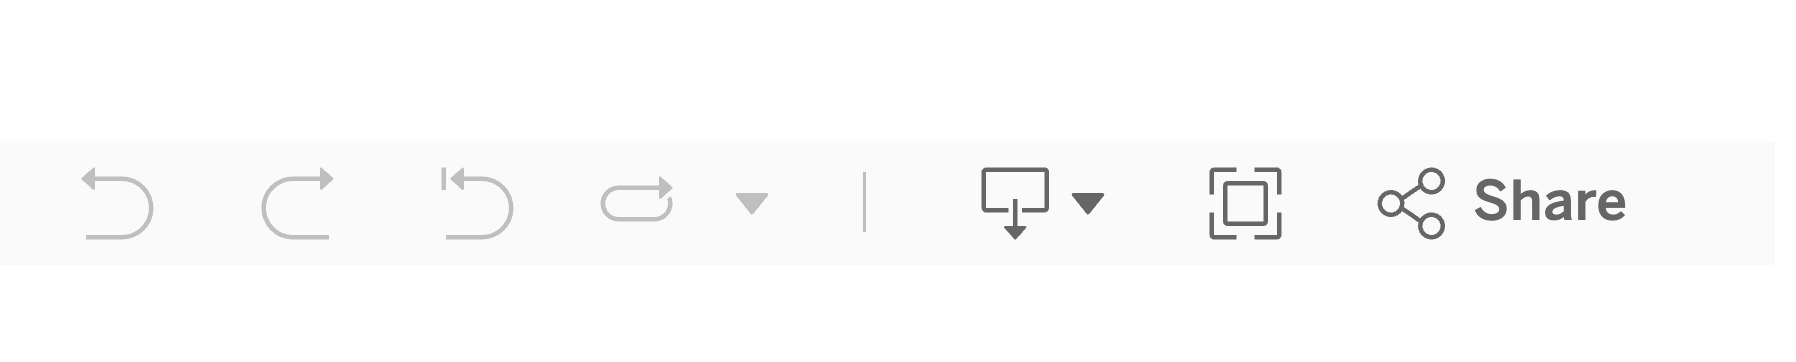
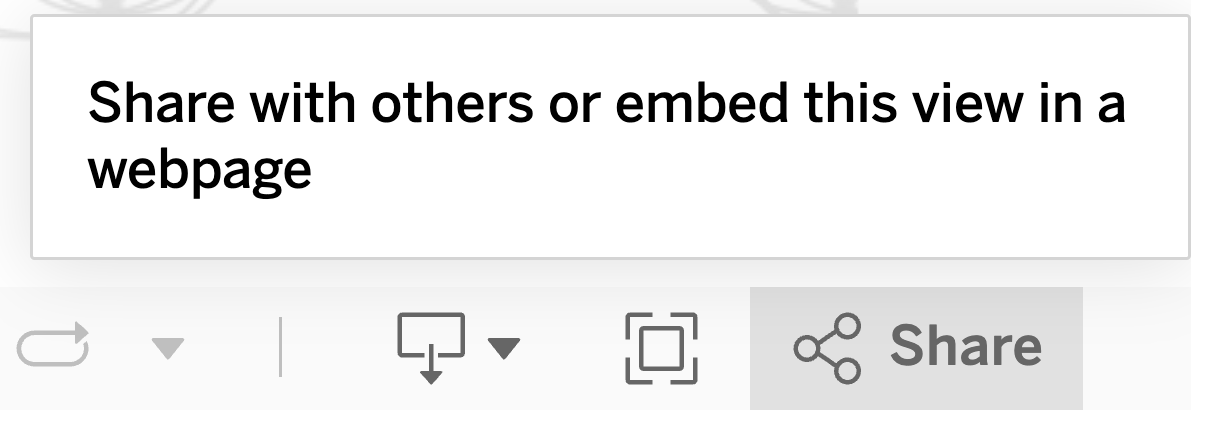
There are three buttons at the bottom right corner of each visualization that allow users to share the infographic by email or social media and to download the visualization in three different formats. Click on the relevant icon to share or save your country data in any of the four Index visualizations.
To share your viz image
Click on the Share icon
Select email, Twitter or Facebook link or copy link to share on other social media
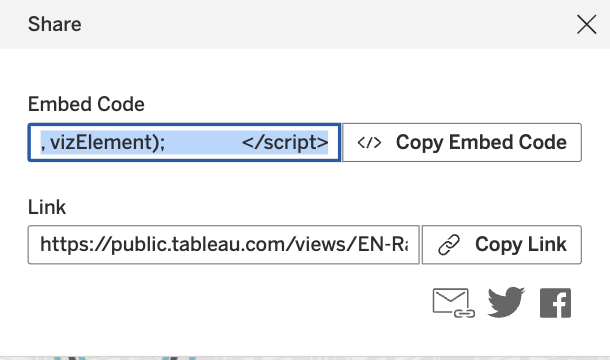
Follow instructions within social media platforms
To download your viz image
Click on the Download icon
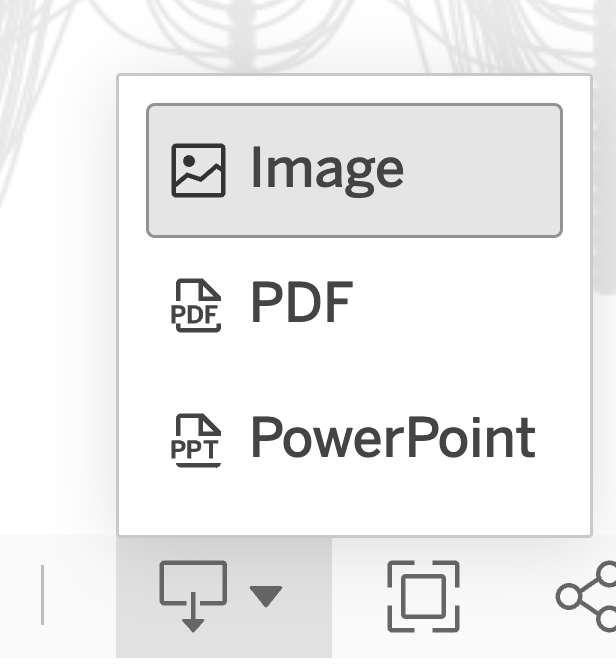
Select format for file