Key Findings

The 2019 SDG Gender Index provides a snapshot of where the world stands, right now, linked to the vision of gender equality set forth by the 2030 Agenda. It measures the state of gender equality aligned to 14 of the 17 Sustainable Development Goals (SDGs) in 129 countries in five regions and 51 issues ranging from health, gender-based violence, climate change, decent work and others. Overall, the index finds that, across all the goals and indicators studied, no country has fully achieved the promise of gender equality.
Download the 2019 SDG Gender Index (in English, en Français, and en Español)
Scoring System
The overall index score and individual goal scores are based on a scale of 0-100. A score of 100 reflects the achievement of gender equality in relation to the targets set for each indicator in the index (for example, that 100% of girls’ complete secondary education or that there is around 50-50 parity for women and men in Parliament). A score of 50 signifies that a country is about halfway to meeting that goal. Scoring system:
- Excellent: 90 and above
- Good: 80-89
- Fair: 70-79
- Poor: 60-69
- Very poor: 59 and below
Download the 2019 SDG Gender Index (in English, en Français, and en Español)
Key Findings
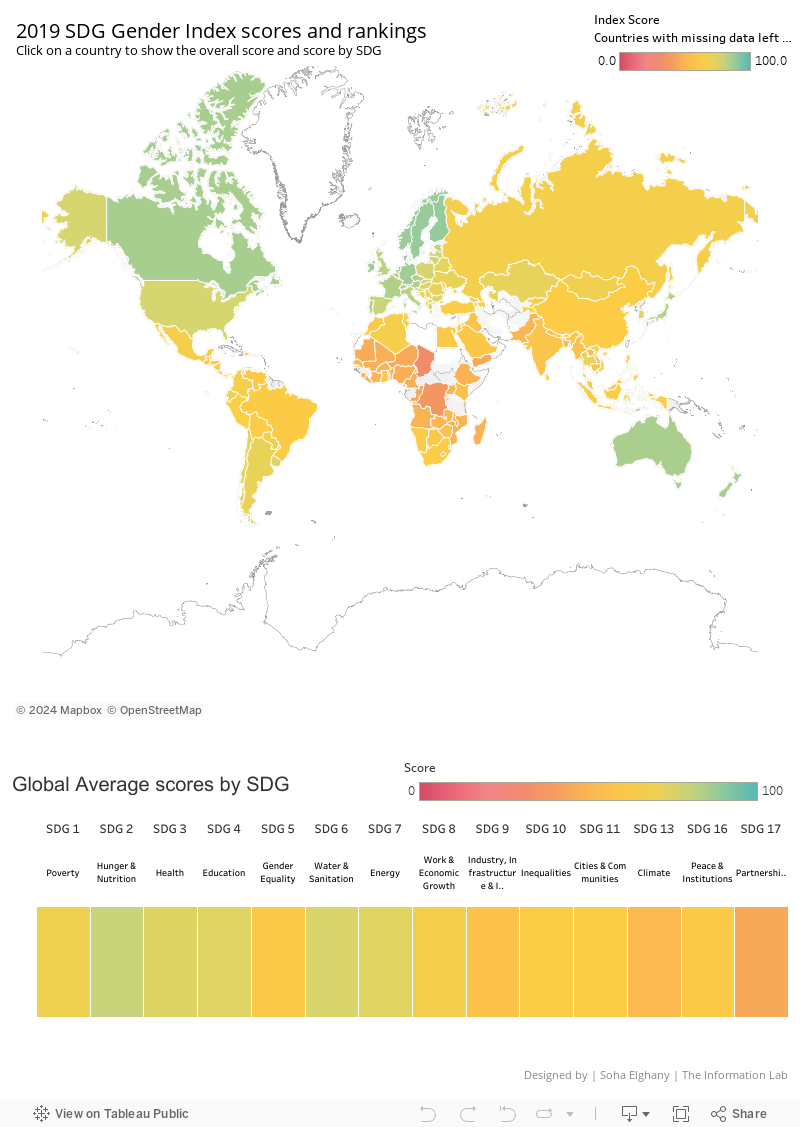
- Global areas of improvement: The world is furthest behind on gender equality issues related to public finance and better gender data (SDG 17), climate change (SDG 13), gender equality in industry and innovation (SDG 9) and – worryingly – the standalone ‘gender equality’ goal (SDG 5).
- Global areas of relative strength: Overall, countries have performed best on issues where coordinated and concerted policy focus and funding has been directed over the past 10-20 years, including on hunger and nutrition (SDG 2), water and sanitation (SDG 6), health (SDG 3) and education (SDG 4).
- Highest scoring 10 countries by overall index score: Denmark, Finland, Sweden, Norway, Netherlands, Slovenia, Germany, Canada, Ireland, and Australia.
- Lowest scoring 10 countries by overall index score: Sierra Leone, Liberia, Nigeria, Mali, Mauritania, Niger, Yemen, Congo, Democratic Republic of Congo, and Chad – all appear in The Organisation for Economic Co-operation’s (OECD) 2018 list of fragile states.
- GDP and gender equality: Overall, higher-income countries are more likely to have greater gender equality than lower-income countries. But the data show that this is not always the case:
- Finland, Georgia, Greece, Kyrgyzstan, Malawi, Rwanda, Slovenia, and Viet Nam, among others, have higher gender equality scores than would be expected based on their GDP per capita.
- Botswana, Iraq, Malaysia, Russia, South Korea, Switzerland, Turkey, and the United States, among others, have lower gender equality scores than might be expected given their income levels.
- Gender equality in lower performing countries: There are pockets of progress even among the index’s lower performing regions and countries. For example:
- The majority of the top scoring countries on indicators related to women’s participation in government and the judiciary are Latin American and Sub-Saharan African countries.
- Several lower-income countries perform well on indicators that capture women’s physical safety, through their perceptions of how safe women feel walking alone at night: Rwanda, for example, has the fifth highest score globally on this indicator.
- Women are more likely to have had their need for modern methods of family planning met in Brazil, China, Costa Rica, Nicaragua, Thailand and Uruguay, than in Canada, Denmark, Netherlands, Norway and Sweden (though they still receive “good” or “excellent” scores on the measure).
- Kenya has very high rates of women who use digital banking – higher rates than three quarters of the world’s countries.
The next iteration of the index will be launched around 2021/2022 and updated regularly until 2030. Stay up to date on our latest projects and products, subscribe to our monthly e-newsletter.
Download 2019 SDG Gender Index Graphs
- SDG Gender Index, Issues, Figure 1
- SDG Gender Index, Country Scores, Map, Figure 2
- SDG Gender Index, Number of Girls and Women Living in Countries by Index Score Grouping, Figure 3
- SDG Gender Index, Countries by Index Score Grouping, Figure 4
- SDG Gender Index, Index Scores and National Per Capita Income, Figure 5
- SDG Gender Index, Global Scores by Goals, Figure 6
- SDG Gender Index, Index Scores Asia and the Pacific, Figure 7
- Proportion of Ministerial/Senior Government Positions Held by Women, Figure 8
- Secondary Education Attainment Among Women, Bangladesh, India, Pakistan, Figure 9
- SDG Gender Index, Index Scores Europe and North America, Figure 10
- Women in STEM Research and STEM Expenditure, Europe and North America, Figure 11
- Extent of Freedom of Association and Collective Bargaining Rights in Law, Figure 12
- SDG Gender Index, Index Scores Latin America and the Caribbean, Figure 13
- Proportions of Women Justices on a Country’s Supreme Court of Higher Court, Figure 14
- Women’s Perception of Feeling Safe Walking Alone at Night and Female Homicide Rates, Figure 15
- SDG Gender Index, Index Scores Middle East and North Africa, Figure 16
- Proportion of Women Who Have Made or Received Digital Payments in the Past Year, Figure 17
- Extent of Legal Barriers That Women Face in Work and Land Ownership, Figure 18
- SDG Gender Index, Index Scores Sub-Saharan Africa, Figure 19
- Climate Vulnerability Score in Sub-Saharan Africa, Figure 20
- Proportion of Ministerial or Senior Government Roles Held by Women, Figure 21
- Awareness, Attitude Towards, and Prevalence of Female Circumcision by Ethnic Group of Household Head in Nigeria, Figure 22
- Median Earnings by Selected Characteristics in the United States, Figure 23
- Global Estimates of New HIV Infections Among 15-24 Year Olds by Sex, Figure 24
- Employment Rates for Persons With and Without Disabilities by Sex in 51 Countries, Figure 25